TikZ package
TikZ is a powerful package for creating graphics and diagrams in LaTeX. It provides a flexible and intuitive way to design high-quality visuals directly within your LaTeX documents. With TikZ, you can draw a wide range of shapes, paths, curves, and more, allowing you to customize your graphics to suit your needs. In this section, we will explore the basics of TikZ and its importance in enhancing the visual elements of your LaTeX documents.
Introduction
TikZ is a feature-rich package in LaTeX that empowers users to create a diverse range of graphics and diagrams. Whether you need simple illustrations or complex diagrams, TikZ provides the tools to bring your ideas to life with precision and flexibility. With TikZ, you have the ability to:
- Create diverse shapes, paths, and curves to design personalized visuals.
- Exercise full control over graphic design, ensuring precise alignment, styling, and labeling.
- Access a wide range of functionalities, including nodes, coordinates, text placement, and advanced features like arrows and patterns.
- Generate vector-based graphics, guaranteeing high-quality output regardless of document size or scaling, suitable for digital and print formats.
Basic Drawing with TikZ
Drawing simple shapes, such as lines, rectangles, and circles, is one of the key capabilities of TikZ in LaTeX. In this section, you will learn the fundamental techniques and commands for drawing simple shapes and objects. You will also explore customizing line styles, colors, and thickness to enhance your drawings. Additionally, you will discover how to fill shapes with colors or patterns for added visual impact.
Drawing simple shapes
To draw basic shapes using TikZ, you can follow these steps:
1. First you need to include the TikZ package in your LaTeX document's preamble. Start by adding the following line of code:
\usepackage{tikz}
By including the TikZ package, you gain access to a wide range of tools and options for creating high-quality graphics and diagrams in LaTeX.
2. Use the following commands to define the TikZ picture environment within your document:
\begin{tikzpicture}
    % TikZ commands go here
\end{tikzpicture}
Any TikZ commands placed between these two commands will be part of the picture.
3. Use TikZ commands to specify the desired shape. In the upcoming sections, we will explore commands for drawing commonly used shapes. These commands will allow you to customize the size, position, color, and style of the shapes to suit your needs. Stay tuned for step-by-step instructions and code examples for each shape.
Drawing lines
Within the TikZ picture environment, use the \draw command to specify the line you want to draw. The basic syntax is:
\draw (x1, y1) -- (x2, y2);
Where:
(x1, y1)→ This specifies the starting point of the line segment. Replacex1andy1with the desired coordinates, where x represents the horizontal position and y represents the vertical position.(x2, y2)→ This specifies the ending point of the line segment. Replacex2andy2with the desired coordinates.--→ This operator connects these two points with a straight line segment.
It is necessary to include a semicolon at the end of each TikZ command or path to indicate that the command or path is complete.
The semicolon serves as a separator between consecutive TikZ commands within a tikzpicture environment. It ensures that each command is executed independently and that the subsequent command starts a new instruction.
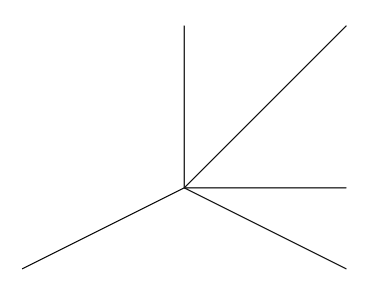
Here's an example of drawing simple lines using TikZ:
\documentclass{article}
\usepackage{tikz}

\begin{document}

\begin{tikzpicture}
    \draw (0, 0) -- (2, 2);
    \draw (0, 0) -- (0, 2);
    \draw (0, 0) -- (2, 0);
    \draw (0, 0) -- (2, -1);
    \draw (0, 0) -- (-2, -1);
\end{tikzpicture}

\end{document}
This example generates the following output:
Drawing circles
To draw a circle using the TikZ package, you can use the \draw command with the circle option:
\draw (x, y) circle (radius);
Where:
(x, y)→ specifies the center point of the circle.radius→ denotes the radius of the circle. It can be specified in various units such as cm, mm, in, or pt.
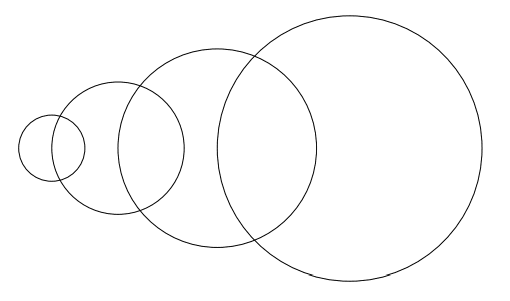
Here's an example:
\documentclass{article}
\usepackage{tikz}

\begin{document}

\begin{tikzpicture}
  \draw (0, 0) circle (0.5cm);
  \draw (1, 0) circle (1cm);
  \draw (2.5, 0) circle (1.5cm);
  \draw (4.5, 0) circle (2cm);
\end{tikzpicture}

\end{document}
This example generates the following output:
Drawing ellipses
You can draw an ellipse using the \draw command with the following syntax:
\draw (x, y) ellipse (x-radius and y-radius);
Where:
(x, y)→ specifies the center coordinates of the ellipse.x-radiusandy-radius→ determine the horizontal and vertical radius of the ellipse.
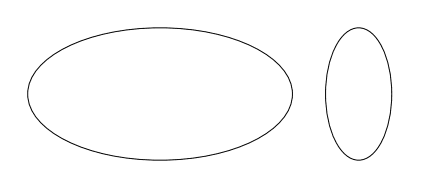
Here's an example of drawing ellipses:
\documentclass{article}
\usepackage{tikz}

\begin{document}
\begin{tikzpicture}
  \draw (0, 0) ellipse (2 and 1);
  \draw (3, 0) ellipse (0.5 and 1);
\end{tikzpicture}
\end{document}
This example generates the following output:
Drawing rectangles
To draw a rectangle in TikZ, you can specify two points: the starting point and the diagonally opposite corner point. The basic syntax for drawing a rectangle using these points is as follows:
\draw (x1, y1) rectangle (x2, y2);
Here,
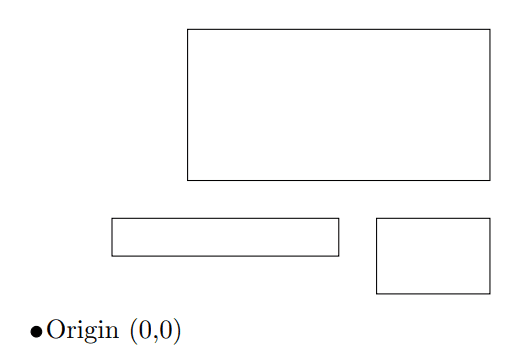
(x1, y1)→ represents the starting point of the rectangle(x2, y2)→ represents the diagonally opposite corner point Here's an example of drawing rectangles:
\documentclass{article}
\usepackage{tikz}

\begin{document}

\begin{tikzpicture}
  \draw (2, 2) rectangle (6, 4);
  \draw (1, 1) rectangle (4, 1.5);
  \draw (4.5, 0.5) rectangle (6, 1.5);

  \filldraw[black] (0,0) circle (2pt) node[anchor=west]{Origin (0,0)};
\end{tikzpicture}

\end{document}
This example generates the following output:
Drawing triangles
To draw a triangle using TikZ, you can use the \draw command with the following syntax:
\draw (x1, y1) -- (x2, y2) -- (x3, y3) -- cycle;
Where:
(x1, y1),(x2, y2), and(x3, y3)→ are the coordinates of the three vertices of the triangle.--→ is used to connect the vertices with lines. It indicates that a line should be drawn from the first coordinate to the second, from the second to the third, and so on.cycle→ is added at the end to close the path and complete the triangle. It connects the last vertex back to the first vertex, creating a closed shape.
Here's an example of drawing triangles:
\documentclass{article}
\usepackage{tikz}

\begin{document}

\begin{tikzpicture}
  \draw (0, 0) -- (2, 0) -- (1, 1) -- cycle;
  \draw (0, 1.3) -- (2.7, 1.3) -- (1, 3) -- cycle;
  \draw (2.5, 0) -- (6, 0) -- (4, 3) -- cycle;

  \filldraw[black] (0,0) circle (2pt) node[anchor=north]{Origin (0,0)};
\end{tikzpicture}

\end{document}
This example generates the following output:
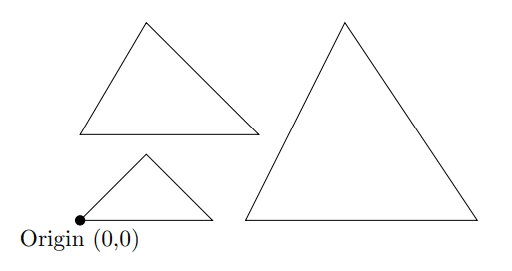
You can adjust the coordinates to create triangles of different sizes and positions.
Customizing line thickness, color, and styles
To specify additional options like line thickness, color, and style in TikZ, you can include them as optional arguments within the \draw command. Here's how you can use these options:
1. Line Thickness
You can control the thickness of the line using the line width option:
\draw[line width=<thickness>] (x1, y1) -- (x2, y2);
In this syntax, <thickness> represents the desired line thickness. You can specify the thickness using various units such as pt, mm, cm, or in.
For example, to draw a line with a thickness of 1.5pt that starts from the point (0, 0) and ends at the point (2, 2), you can use the following command:
\draw[line width=1.5pt] (0, 0) -- (2, 2);
In TikZ, there are also several predefined line width options that you can use to specify the thickness of a line. Here are some commonly used options:
| Option | Description |
|---|---|
ultra thin | A very thin line. |
very thin | A thin line. |
thin | A standard thickness line. |
semithick | A slightly thicker line than thin. |
thick | A thicker line. |
very thick | A very thick line. |
ultra thick | The thickest line. |
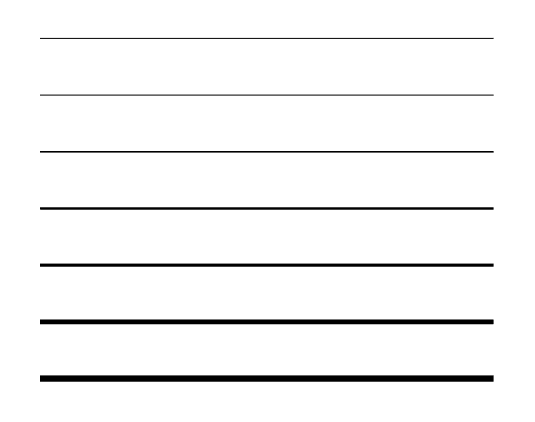
These options provide a convenient way to set the line width without specifying the thickness in specific units like pt or mm. Here's an example that demonstrates the usage of a predefined line width options:
\documentclass{article}
\usepackage{tikz}

\begin{document}

\begin{tikzpicture}
    \draw [ultra thick] (0, 0) -- (4, 0);
    \draw [very thick] (0, 0.5) -- (4, 0.5);
    \draw [thick] (0, 1) -- (4, 1);
    \draw [semithick] (0, 1.5) -- (4, 1.5);
    \draw [thin] (0, 2) -- (4, 2);
    \draw [very thin] (0, 2.5) -- (4, 2.5);
    \draw [ultra thin] (0, 3) -- (4, 3);
\end{tikzpicture}

\end{document}
This example generates the following output:
2. Line color
In TikZ, you can specify the color of a line using the color option. Here's how you can do it:
\draw[color=yellow] (0, 0) -- (2, 2);
color option allow you to specify a wide range of colors, including predefined colors like red, blue, green, etc., as well as custom colors using RGB, CMYK, or HTML color codes.
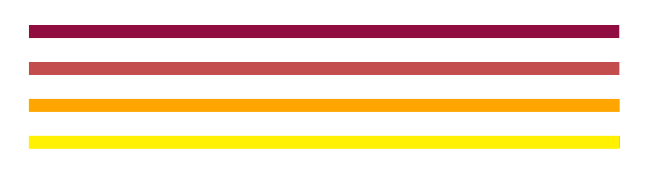
To define custom colors in TikZ, you can use the \definecolor command. Once you have defined a color, you can use it in the \draw command or any other TikZ command that requires a color parameter. For example:
\documentclass{article}
\usepackage{tikz}

\definecolor{mycolor1}{RGB}{255, 165, 0} % Define custom color (RGB)
\definecolor{mycolor2}{cmyk}{0, 0.78, 0.56, 0.22} % Define custom color (CMYK)
\definecolor{mycolor3}{HTML}{900C3F} % Define custom color (HTML)

\begin{document}

\begin{tikzpicture}

  % Predefined color (yellow)
  \draw [color=yellow, line width=5pt] (0, 0) -- (8, 0);

  % Custom color using RGB color model
  \draw[mycolor1, line width=5pt] (0, 0.5) -- (8, 0.5);

  % Custom color using CMYK color model
  \draw[mycolor2, line width=5pt] (0, 1) -- (8, 1);

  % Custom color using HTML color code
  \draw[mycolor3, line width=5pt] (0, 1.5) -- (8, 1.5);

\end{tikzpicture}

\end{document}
This example generates the following output:
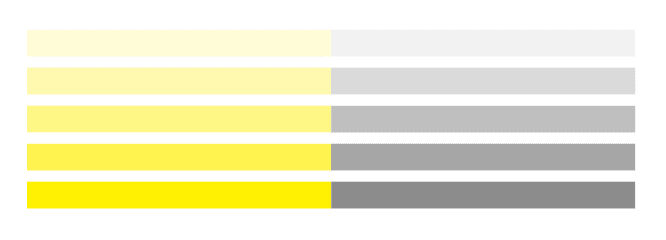
You can use percentage values to specify lighter or darker shades of colors. By adjusting the percentage, you can control the brightness or darkness of a color. This technique is particularly useful for creating variations of a base color without having to manually define each shade. For example:
\documentclass{article}
\usepackage{tikz}
\usepackage{xcolor}

\begin{document}

\begin{tikzpicture}
    \draw [color=yellow, line width=10pt] (0, 0) -- (4, 0);
    \draw [color=yellow!80, line width=10pt] (0, 0.5) -- (4, 0.5);
    \draw [color=yellow!60, line width=10pt] (0, 1) -- (4, 1);
    \draw [color=yellow!40, line width=10pt] (0, 1.5) -- (4, 1.5);
    \draw [color=yellow!20, line width=10pt] (0, 2) -- (4, 2);

    \draw [color=gray!90, line width=10pt] (4, 0) -- (8, 0);
    \draw [color=gray!70, line width=10pt] (4, 0.5) -- (8, 0.5);
    \draw [color=gray!50, line width=10pt] (4, 1) -- (8, 1);
    \draw [color=gray!30, line width=10pt] (4, 1.5) -- (8, 1.5);
    \draw [color=gray!10, line width=10pt] (4, 2) -- (8, 2);
\end{tikzpicture}

\end{document}
This example generates the following output:
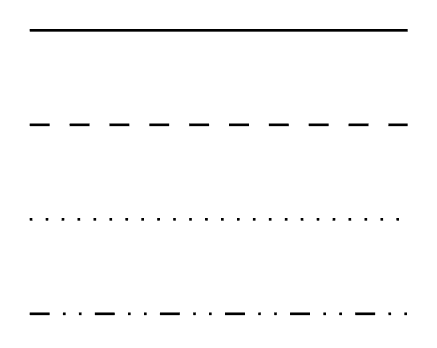
3. Line style
TikZ offers various line styles such as solid, dashed, dotted, and more. Line styles can be applied to lines, curves, and other graphical elements drawn using TikZ.
Here are some commonly used line styles in TikZ:
| Line Style | Description |
|---|---|
solid | This is the default line style, creating a solid line. |
dashed | This style creates a line with evenly spaced dashes. |
dotted | This style creates a line with evenly spaced dots. |
dash dot | This style creates a line with alternating dashes and dots. |
dash dot dot | This style creates a line with a repeating pattern of dash-dot-dot. |
To apply a line style, you can include the corresponding option in the \draw command. For example:
\documentclass{article}
\usepackage{tikz}

\begin{document}
\begin{tikzpicture}
  \draw (0, 0) -- (2, 0); % Solid line (default)
  \draw[dashed] (0, -0.5) -- (2, -0.5); % Dashed line
  \draw[dotted] (0, -1) -- (2, -1); % Dotted line
  \draw[dash dot dot] (0, -1.5) -- (2, -1.5); % Dash dot dot pattern
\end{tikzpicture}
\end{document}
This example generates the following output:
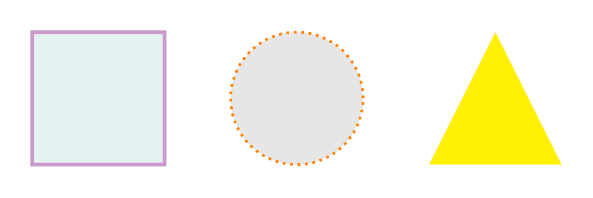
Fill shapes with colors or patterns
In TikZ, the \fill and \filldraw commands are used to fill shapes with colors or patterns.
fill→ is used to fill the shape without drawing its boundary.filldraw→ is used to fill the shape and draw its boundary simultaneously.
Here's an example of filling shapes with colors:
\documentclass{article}
\usepackage{tikz}
\usepackage{xcolor}

\begin{document}

\begin{tikzpicture}
  % Using \filldraw to fill a rectangle with a teal color and a violet border, drawn with an extremely thick line.
  \filldraw [color=violet!40, fill=teal!10, ultra thick] (0,0) rectangle (2,2);

  % Using \filldraw with an orange border, filled with a light gray color, and drawn with a very thick dotted line.
  \filldraw[color=orange, fill=gray!20, very thick, dotted] (4,1) circle (1cm);

  % Using \fill to draw a triangle shape filled with yellow color without drawing its boundary.
  \fill[yellow] (6,0) -- (8,0) -- (7,2) -- cycle;
\end{tikzpicture}

\end{document}
This example generates the following output:
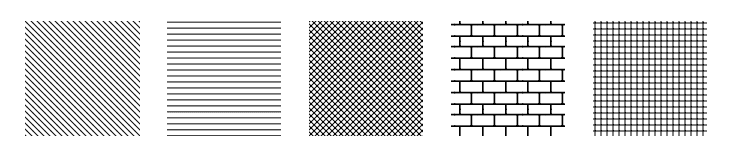
By using the \pattern command, you can apply a variety of patterns to fill shapes in TikZ. TikZ provides several predefined patterns that you can use to fill shapes. Some of the commonly used predefined patterns include:
| Pattern | Description |
|---|---|
horizontal lines | Fills the shape with evenly spaced horizontal lines. |
vertical lines | Fills the shape with evenly spaced vertical lines. |
north east lines | Fills the shape with diagonal lines running from the top left to the bottom right. |
north west lines | Fills the shape with diagonal lines running from the top right to the bottom left. |
grid | Fills the shape with a grid pattern. |
crosshatch | Fills the shape with a crosshatch pattern. |
dots | Fills the shape with evenly spaced dots. |
bricks | Fills the shape with a pattern resembling bricks. |
checkerboard | Fills the shape with a checkerboard pattern. |
In TikZ, the \pgfdeclarepattern command is used to define custom patterns for filling shapes. It allows you to create unique patterns by specifying the pattern's dimensions and drawing commands. These custom patterns can then be used to fill shapes using the \fill command with the pattern option.
In order to use patterns, you need to load the patterns library by adding \usetikzlibrary{patterns} to the preamble of your document.
Here's an example of using predefined patterns:
\documentclass{article}
\usepackage{tikz}
\usetikzlibrary{patterns}

\begin{document}

\begin{tikzpicture}
  \fill[pattern=north west lines] (0,0) rectangle (2,2);
  \fill[pattern=horizontal lines] (2.5,0) rectangle (4.5,2);
  \fill[pattern=crosshatch] (5,0) rectangle (7,2);
  \fill[pattern=bricks] (7.5,0) rectangle (9.5,2);
  \fill[pattern=grid] (10,0) rectangle (12,2);
\end{tikzpicture}

\end{document}
This example generates the following output:
Creating paths, arc, and curves
Creating paths and curves in TikZ is a powerful feature that allows you to draw complex and customized shapes in your LaTeX documents. Paths are constructed using a series of coordinates, control points, and commands to define the desired shape. You can create straight lines, curves, arcs, and more, giving you full control over the design of your diagrams and illustrations. Let's dive into the world of creating paths, arcs, and curves with TikZ!
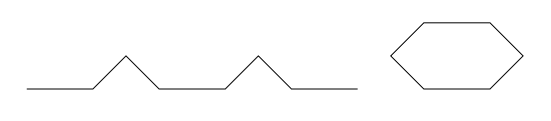
Drawing paths with multiple points
In TikZ, a path refers to a sequence of connected points or coordinates that are used to draw lines, curves, or shapes. By specifying multiple points, you can create polygons, polylines, or any desired shape with straight line segments. The basic syntax for drawing polygons and polylines in TikZ is as follows:
- For Polylines:
\draw (x1, y1) -- (x2, y2) -- (x3, y3) -- ... -- (xn, yn); - For Polygons:
\draw (x1, y1) -- (x2, y2) -- (x3, y3) -- ... -- (xn, yn) -- cycle;
Where:
- Each pair of coordinates
(xi, yi)represents a point on the path. - The
--symbol is used to connect the points and create a continuous line or shape. - For polygons, the
cyclecommand is used to close the shape by connecting the last vertex to the first vertex with a straight line.
For example:
\documentclass{article}
\usepackage{tikz}

\begin{document}
\begin{tikzpicture}
    % polyline
    \draw (0, 0) -- (1, 0) -- (1.5, 0.5) -- (2, 0) -- (3, 0) -- (3.5, 0.5) -- (4, 0) -- (5, 0);

    % Polygon
    \draw (6, 0) -- (7, 0) -- (7.5, 0.5) -- (7, 1) -- (6, 1) -- (5.5, 0.5) -- cycle;
\end{tikzpicture}
\end{document}
This example generates the following output:
Drawing arcs
There are two main ways to draw arcs in TikZ:
1. Using the \draw command with the arc option:
\draw (x, y) arc (start angle:end angle:radius);
Where:
(x, y)→ The center of the circle that defines the arc.start angle→ The angle at which the arc starts (in degrees).end angle→ The angle at which the arc ends (in degrees).radius→ The radius of the circle that defines the arc.
Example:
\documentclass{article}
\usepackage{tikz}
\begin{document}
\begin{tikzpicture}
% Drawing an arc with center (0,0), radius 1.5, starting angle 0, and ending angle 130 degrees
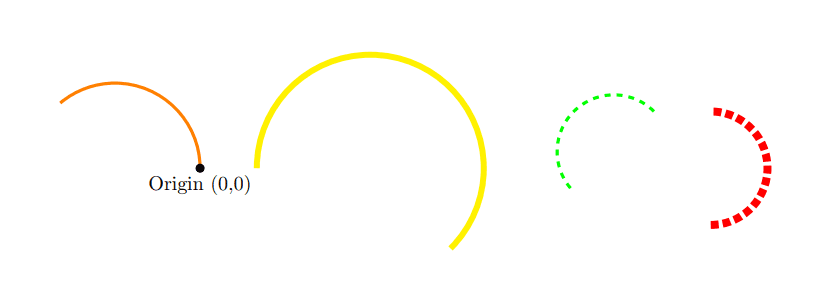
\draw [orange, ultra thick] (0, 0) arc (0:130:1.5);
% Drawing an arc with center (1,0), radius 2, starting angle 180, and ending angle -45 degrees
\draw [yellow, line width=3pt] (1, 0) arc (180:-45:2);
% Drawing a dashed arc with center (8,1), radius 1, starting angle 45, and ending angle 225 degrees
\draw[green, dashed, ultra thick] (8, 1) arc (45:225:1);
% Drawing a dotted arc with center (9,-1), radius 1, starting angle -90, and ending angle 90 degrees
\draw[red, line width=4pt, dotted] (9, -1) arc (-90:90:1);
% origin point
\filldraw[black] (0,0) circle (2pt) node[anchor=north]{Origin (0,0)};
\end{tikzpicture}
\end{document}
This example generates the following output:
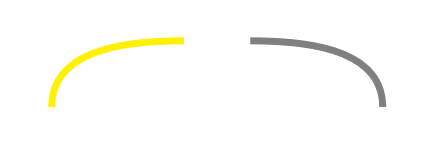
2. Using the \draw command with the to option:
\draw (start point) to[out=angle1, in=angle2] (end point);
Where:
start point→ The starting point of the arc.end point→ The ending point of the arc.out→ The angle at which the arc starts at the starting point (in degrees).in→ The angle at which the arc ends at the ending point (in degrees).
Here's an example of drawing arcs:
\documentclass{article}
\usepackage{tikz}

\begin{document}

\begin{tikzpicture}
  \draw[yellow, line width=3pt] (0, 0) to[out=90, in=180] (2, 1);
  \draw[gray, line width=3pt] (5, 0) to[out=90, in=0] (3, 1);
\end{tikzpicture}

\end{document}
This example generates the following output:
Curved paths and Bezier curves
The basic syntax for drawing a curved path and Bezier curves in TikZ using the \draw command is as follows:
\draw (start point) .. controls (control point 1) and (control point 2) .. (end point);
Here's a breakdown of the syntax:
(start point)→ Specifies the starting point of the curved path... controls (control point 1) and (control point 2) ..→ Defines the control points for the Bezier curve. These control points determine the direction and curvature of the curve.(end)→ Specifies the ending point of the curved path.
You can add multiple sets of .. controls .. to create a path with multiple curves. Each set of control points defines the curvature of the curve segment between two points.
Here's an example of drawing curved paths:
\documentclass{article}
\usepackage{tikz}
\begin{document}
\begin{tikzpicture}
% curved paths
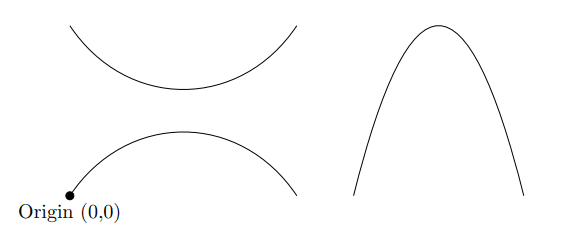
\draw (0, 0) .. controls (1, 1.5) and (3, 1.5) .. (4, 0);
\draw (0, 3) .. controls (1, 1.5) and (3, 1.5) .. (4, 3);
\draw (5, 0) .. controls (6, 4) and (7, 4) .. (8, 0);
% origin point
\filldraw[black] (0,0) circle (2pt) node[anchor=north]{Origin (0,0)};
\end{tikzpicture}
\end{document}
This example generates the following output:
Using nodes and coordinates
In TikZ, nodes and coordinates are essential elements for positioning and adding content to your drawings. They provide a way to label specific points, place text, and create complex structures within your TikZ picture.
Nodes are used to label points or create complex shapes, while coordinates define the positions of nodes and other graphical elements within the picture.
The basic syntax for creating a node in TikZ is as follows:
\node [options] (name) {content};
Explanation:
| Argument | Description |
|---|---|
[options] | This is an optional argument, where you can use various options to customize the appearance and behavior of the node. |
(name) | This is the name of the node, which you can use to refer to it later in the code. |
{content} | This is the text or content that will be displayed inside the node. |
For example, to create a simple node with the text "Node1" and name it "myNode", you can use the following code:
\documentclass{article}
\usepackage{tikz}

\begin{document}
\begin{tikzpicture}
  \node (myNode) {Node1};
\end{tikzpicture}
\end{document}
This example generates the following output:
Customizing the appearance of the node
Here's a more detailed explanation of the options you can use when creating node usnig the \node commmand:
-
Shape: You can specify the shape of the node using the shape option. For example, rectangle, circle, etc.
-
Color: The
filloption sets the fill color of the node, while thedrawoption sets the color of the node's border. -
Size: The
minimum sizeandinner sepoptions control the size of the node. The "minimum size" sets the minimum size of the node's box, while the "inner sep" specifies the distance between the node's content and its border. -
Text and Font: You can use the
textandfontoptions to control the content and font style of the node. For example,text=redwill set the text color to red, andfont=\sffamily\bfserieswill make the text bold and sans-serif. -
Position: The
atoption allows you to set the position of the node using coordinates. For example,at (2, 3)will place the node at position (2, 3) in the TikZ picture. -
Label: The
labeloption is used to add a label to the node. The label is placed outside the node and can be used to reference the node in the TikZ code. -
Styles: You can define custom styles for nodes using the
styleoption. For example, you can define a style with a specific shape, color, and font, and then apply it to multiple nodes in the picture.
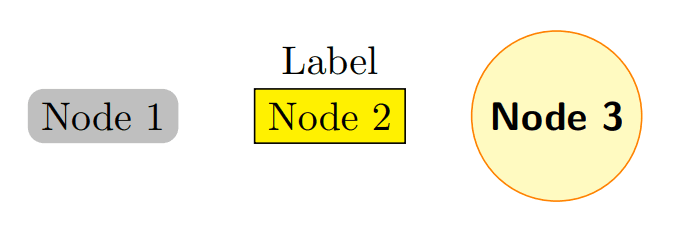
Here's an example using some of these options:
\documentclass{article}
\usepackage{tikz}

\begin{document}
\begin{tikzpicture}
    % Basic node
    \node[rectangle, fill=gray!50, rounded corners] (node1) {Node 1};

    % Node with label
    \node[rectangle, draw, fill=yellow, label=above:Label] (node2) at (2, 0) {Node 2};

    % Custom style for nodes
    \tikzset{
        mynode/.style={
            circle,
            draw=orange,
            fill=yellow!30,
            minimum size=1.5cm,
            font=\sffamily\bfseries,
        }
    }
    \node[mynode] (node3) at (4, 0) {Node 3};
\end{tikzpicture}
\end{document}
This example generates the following output:
Node positioning options in TikZ
In TikZ, there are several common positioning options that allow you to position nodes relative to each other in a TikZ picture. The basic syntax for using positioning options in TikZ is as follows:
\node (name) [positioning options] {content};
Some of the common positioning options are:
| Positioning Option | Description |
|---|---|
above | Positions the node above the reference node. |
below | Positions the node below the reference node. |
left | Positions the node to the left of the reference node. |
right | Positions the node to the right of the reference node. |
above left | Positions the node above and to the left of the reference node. |
above right | Positions the node above and to the right of the reference node. |
below left | Positions the node below and to the left of the reference node. |
below right | Positions the node below and to the right of the reference node. |
left of | Positions the node to the left of the specified node. |
right of | Positions the node to the right of the specified node. |
above of | Positions the node above the specified node. |
below of | Positions the node below the specified node. |
above left of | Positions the node above and to the left of the specified node. |
above right of | Positions the node above and to the right of the specified node. |
below left of | Positions the node below and to the left of the specified node. |
below right of | Positions the node below and to the right of the specified node. |
above=distance | Positions the node at a specified distance above the reference node. |
below=distance | Positions the node at a specified distance below the reference node. |
left=distance | Positions the node at a specified distance to the left of the reference node. |
right=distance | Positions the node at a specified distance to the right of the reference node. |
You can use these positioning options to create complex layouts of nodes in your TikZ diagrams, aligning them relative to each other or to specific coordinates.
Drawing arrows
In TikZ, you can draw arrows to indicate directions or flow. Arrows provide visual cues and are commonly used in diagrams, flowcharts, and graphs.
To use arrows in your TikZ picture, you need to load the arrows library in your LaTeX document preamble:
\usetikzlibrary{arrows}
The basic syntax for drawing arrows using TikZ is as follows:
\draw[<arrow style>] (<start coordinates>) -- (<end coordinates>);
Where:
| Argument | Description |
|---|---|
arrow style | This is an optional argument that specifies the style of the arrowhead. You can use predefined arrow styles such as ->, <-, <->, ->>, etc., or define your custom arrowhead style. |
start coordinates | The starting coordinates of the arrow, written as (x, y). |
-- | The TikZ operator to draw a straight line between the starting and ending coordinates. |
end coordinates | The ending coordinates of the arrow, written as (x, y). |
You can customize the appearance of arrowheads by specifying additional options such as color, line width, etc., inside the square brackets.
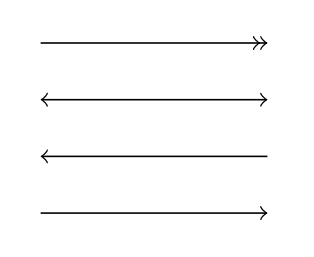
Here's an example of drawing arrows in TikZ:
\documentclass{article}
\usepackage{tikz}

\begin{document}
\begin{tikzpicture}
    \draw[->] (0, 0) -- (2, 0);
    \draw[<-] (0, 0.5) -- (2, 0.5);
    \draw[<->] (0, 1) -- (2, 1);
    \draw[->>] (0, 1.5) -- (2, 1.5);
\end{tikzpicture}
\end{document}
This example generates the following output:
Drawing a curved arrow
To draw a curved arrow in TikZ, you can use the to operation along with the out and in options to specify the direction of the curve. Here's the basic syntax:
\draw[options] (start point) to[out=<out angle>, in=<in angle>] (end point);
Where:
| Option | Description |
|---|---|
options | You can specify optional arguments to customize the appearance of the curved arrow, such as arrow style, color, line width, etc. |
start point | The starting point of the arrow. |
end point | The ending point of the arrow. |
out angle | The angle at which the curve leaves the starting point. |
in angle | The angle at which the curve enters the ending point. |
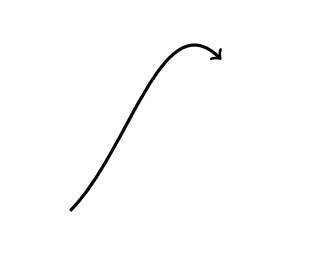
Here's an example of drawing a curved arrow from point (0,0) to (2,2):
\documentclass{article}
\usepackage{tikz}

\begin{document}
\begin{tikzpicture}
    % Curved arrow 1
    \draw[very thick, ->] (0, 0) to[out=45, in=135] (2, 2);
\end{tikzpicture}
\end{document}
This example generates the following output:
Drawing diagrams in TikZ
To draw diagrams in TikZ, you can follow these steps:
- Include the TikZ package in your LaTeX document's preamble, as mentioned in previouse sections:
\usepackage{tikz}
- Begin the
tikzpictureenvironment where you'll draw your diagram:
\begin{tikzpicture}
% Your drawing commands go here
\end{tikzpicture}
- Define the nodes and shapes you want to use in the diagram using
\nodeand\drawcommands. For example, to create a rectangle node:
\node [rectangle, draw] (node1) {This is a rectangle node};
- Position the nodes and shapes using relative or absolute coordinates. For example, to place a node relative to another node:
\node [below of=node1] (node2) {This is below the node1};
- Connect the nodes and shapes using
\drawcommands to create lines or arrows between them. For example, to draw an arrow from node1 to node2:
\draw [->] (node1) -- (node2);
- Customize the appearance of nodes, shapes, lines, and arrows using options like fill, color, line width, rounded corners, etc.
Drawing a state diagram
Here's an example of a simple diagram using TikZ:
\documentclass{article}
\usepackage{tikz}

\begin{document}

\begin{tikzpicture}[
  node distance=2cm,
  myNodeStyle/.style={rectangle, draw, align=center, rounded corners, minimum height=1cm, minimum width=3cm}
  ]

  % Nodes
  \node [myNodeStyle] (start) {Start};
  \node[myNodeStyle] (decision) [below of=start] {Make a Decision};
  \node[myNodeStyle] (outcome1) [left of=decision, xshift=-2.5cm] {Outcome 1};
  \node[myNodeStyle] (outcome2) [right of=decision, xshift=2.5cm] {Outcome 2};
  \node [myNodeStyle] (end) [below of=decision] {End};

  % Arrows
  \draw[->] (start) -- (decision);
  \draw[->] (decision) -- node[above] {Yes} (outcome1);
  \draw[->] (decision) -- node[above] {No} (outcome2);
  \draw[->] (outcome1) |- (end);
  \draw[->] (outcome2) |- (end);

\end{tikzpicture}

\end{document}
This example generates the following output:
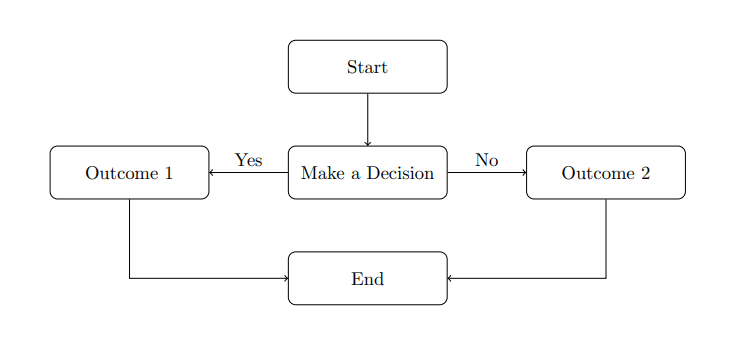
Let's go through the example code:
-
node distance=2cm→ This sets the distance between nodes in the diagram to 2cm. -
myNodeStyle/.style={...}→ This defines a new style called myNodeStyle that specifies the appearance of nodes in the diagram. The style is a rectangle with a border, centered text, rounded corners, and a minimum height and width. -
\node [myNodeStyle] (start) {Start};→ This creates a node with the myNodeStyle style, labeled as "Start", and assigns it the name (start) for later reference. -
[left of=decision, xshift=-2.5cm]→ Places the node to the left of the node named decision and shifts the node 2.5cm to the left. If you usexshift=2.5cmthe node will be shifted 2.5cm to the right. -
\draw[->] (decision) -- node[above] {Yes} (outcome1);→ This draws an arrow from the node named decision to the node named outcome1, with the text "Yes" above the arrow. -
\draw[->] (outcome1) |- (end)→ The symbol|-is used to specify a path that first goes vertically and then horizontally.
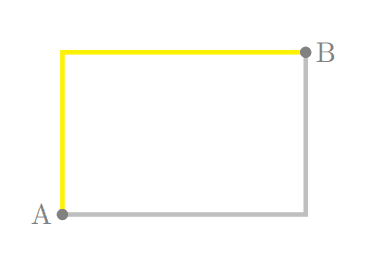
Vertical-Horizontal |- and Horizontal-Vertical -| path specifications in TikZ
In the draw command of TikZ, |- and -| are both used to form L-shaped paths between two points:
|-→ This means that the path first goes in a vertical direction and then in a horizontal direction. The path moves vertically to a specific y-coordinate and then horizontally to a specific x-coordinate.-|→ This means that the path first goes in a horizontal direction and then in a vertical direction. The path moves horizontally to a specific x-coordinate and then vertically to a specific y-coordinate.
Here's an example that demonstrates the difference between |- and -| in TikZ:
\documentclass{article}
\usepackage{tikz}

\begin{document}
\begin{tikzpicture}
  % Points
  \coordinate (A) at (0, 0);
  \coordinate (B) at (3, 2);

  % Draw lines
  \draw[yellow, ultra thick] (A) |- (B);
  \draw[lightgray, ultra thick] (A) -| (B);

  % Draw points
  \fill[gray] (A) circle (2pt) node[left] {A};
  \fill[gray] (B) circle (2pt) node[right] {B};
\end{tikzpicture}
\end{document}
This example generates the following output:
Drawing a flowchart
Here's an example of a flowchart diagram with nodes representing different steps and decisions, and arrows connecting them to illustrate the flow of the process. The nodes are styled with different shapes, colors, and text alignments to make the diagram visually appealing and informative.
\documentclass{article}
\usepackage{tikz}
\usetikzlibrary{shapes.geometric, arrows}

\begin{document}
\begin{tikzpicture}[node distance=2cm,
    startstop/.style={ellipse, draw, fill=blue!20, text width=2.5cm, text centered, minimum height=1cm},
    process/.style={rectangle, draw, fill=orange!30, text width=3cm, text centered, minimum height=1cm},
    decision/.style={diamond, draw, fill=green!20, text width=2cm, text centered, aspect=2},
    arrow/.style={thick,->,>=stealth}
    ]

    % Nodes
    \node[startstop] (start) {Start};
    \node[process, below of=start] (step1) {Process Step 1};
    \node[decision, below of=step1, yshift=-1cm] (decision) {Decision};
    \node[process, below of=decision, yshift=-1.5cm] (step2) {Process Step 2};
    \node[circle, draw, fill=red!20, text width=1cm, text centered, below of=step2, yshift=-1cm] (A) {A};

    % Arrows
    \draw[arrow] (start) -- (step1);
    \draw[arrow] (step1) -- (decision) node[midway, right] {Choice 1};
    \draw[arrow] (decision.east) -- ++(1cm, 0) |- node[above] {Choice 2} (step1);
    \draw[arrow] (decision) -- (step2);
    \draw[arrow] (step2) -- (A);

\end{tikzpicture}
\end{document}
This example generates the following output:
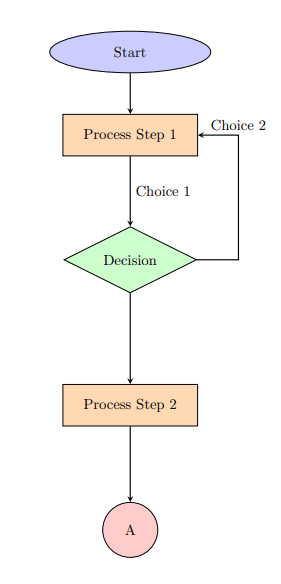
The \usetikzlibrary command allows you to load specific TikZ libraries that provide additional functionalities. In the given code, \usetikzlibrary{shapes.geometric, arrows} loads two TikZ libraries:
- shapes.geometric: This library provides additional geometric shapes that can be used for nodes in the TikZ picture. In the code example, the diamond shape used as a node is part of this library.
- arrows: This library provides various arrowhead styles and options for drawing arrows in TikZ.
Drawing a state transition diagrams using the automata library
The automata library in TikZ is a specialized library designed for drawing state transition diagrams and automata. It provides a set of predefined node styles and options that make it easy to create and customize automata with minimal effort.
To use the automata library, you need to include the following line in the preamble of your LaTeX document:
\usepackage{tikz}
\usetikzlibrary{automata}
Here are some key features of the automata library:
1. Node styles: The library defines several node styles that represent different states in an automaton. The main node styles are:
| Node Style | Description |
|---|---|
state | This style is used for regular states in the automaton. |
initial | This style marks the initial state of the automaton. It adds a small arrow to the state node. |
accepting | This style marks the accepting (final) states of the automaton. It usually adds a double circle around the state node. |
rejection | This style is used for representing a state that leads to the rejection or halting of the automaton. |
2. Edge styles: The library provides a simple way to draw edges between states with arrows representing transitions. You can use the -> option on the \draw command to specify that an arrow should be drawn on an edge.
3.Positioning: The library allows you to position states relative to each other using positioning commands such as below of, right of, and others.
4. Looping: You can easily draw self-loops on states using the loop option.
The library defines styles for drawing edges between states, such as loop above, loop below, loop left, and loop right for self-loops, and bend left, bend right, bend left=angle, and bend right=angle for bending edges between nonadjacent states.
Here's an example of drawing a simple state transition diagram:
\documentclass{article}
\usepackage{tikz}
\usetikzlibrary{automata}

\begin{document}

\begin{tikzpicture}[node distance=2.5cm]
\node[state, initial] (q1) {$q_1$};
\node[state, accepting, right of=q1] (q2) {$q_2$};
\node[state, right of=q2] (q3) {$q_3$};
\draw (q1) edge[loop above, ->] node{0} (q1)
      (q1) edge[above, ->] node{1} (q2)
      (q2) edge[loop above, ->] node{1} (q2)
      (q2) edge[bend left, above, ->] node{0} (q3)
      (q3) edge[bend left, below, ->] node{0, 1} (q2);
\end{tikzpicture}

\end{document}
This example generates the following output:
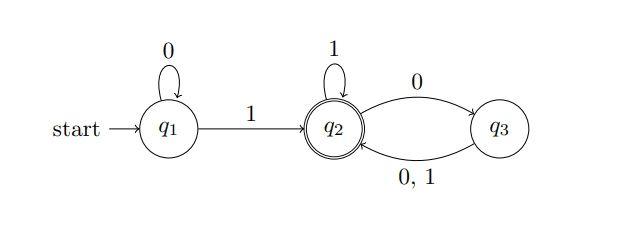
This code creates a simple finite automaton with three states (q1, q2, and q3) and the labled transitions between them, using the automata library styles and options.