Drawing diagrams in LaTeX
Drawing diagrams directly in LaTeX allows you to create custom visualizations, illustrations, and diagrams within your documents. With LaTeX's powerful drawing packages and built-in environments, you can design intricate figures and diagrams that seamlessly integrate with your text.
Introduction
LaTeX's built-in picture environment is a basic tool for creating simple diagrams and illustrations. It allows you to draw lines, curves, and shapes using predefined commands.
By drawing diagrams directly in LaTeX, you can:
- Create professional-looking illustrations that are consistent with the document's style and formatting.
- Have complete control over the design and customization of your diagrams, ensuring they accurately represent your data or concepts.
- Keep your workflow streamlined by including diagrams directly in your LaTeX source code, eliminating the need for external graphics files.
- Easily modify and update diagrams as needed, without relying on external software or files.
Drawing diagrams/figures using picture environment
In LaTeX, you can draw pictures using the built-in picture environment. The picture environment allows you to create simple line drawings using basic geometric shapes and commands.
To use the picture environment in LaTeX and create diagrams or figures, you can follow these steps:
- Before entering the picture environment, use the
\setlengthcommand to set the desired value for\unitlength. For example:
\setlength{\unitlength}{1cm}
This sets the length of \unitlength to 1 centimeter. You can change the value to any desired unit of length (e.g., inches, millimeters) based on your preference.
- Start the
pictureenvironment using the\begin{picture}command. You can specify the picture dimensions using the optional arguments:
\begin{picture}(width, height)(x, y)
    % Drawing commands go here
\end{picture}
- The
widthandheightparameters specify the size of the picture. - The
(x, y)values indicate the coordinates of the reference point within the picture. This point serves as the starting position for drawing objects and is usually the bottom-left corner of the picture.
To understand the picture dimensions, we will create two pictures with a width and height of 4 units. The first picture utilizes the default origin point of (0,0), indicating that the reference point is at the bottom-left corner:
\begin{picture}(4,4)
...
\end{picture}
The second picture will have an altered origin of (2,2), indicating that the reference point is shifted by 2 unit to the right and 2 unit upwards:
\begin{picture}(4,4)(2,2)
...
\end{picture}
By modifying the (x, y) values of the picture environment, we can control the starting point of our drawing within the picture.
-
Inside the
pictureenvironment, you can use various drawing commands. In LaTeX graphics are created by arranging a sequence of commands which generate the building blocks of the picture or illustration. Some of the commonly used commands include:\put(x, y){object}
This command is used to position an object at the specified coordinates (x, y) within the picture.
The object can be any graphical element such as lines, shapes, text, or even other pictures. It allows you to manually place and align elements within the picture.
-
\multiput(x, y)(dx, dy){count}{object}This command allows you to repeat an object multiple times in a specified pattern and is useful for creating repeated patterns or shapes, where:(x, y)→ determine the starting position(dx, dy)→ specifies the incremental distance in the x and y directions for each repetitioncount→ represents the number of repetitions
The
\multiputcommand will repeat the specified object at the specified coordinates (x, y), (x+dx,y+dy), (x+2dx,y+2dy), and so on, for the specified number of count repetitions. -
\qbezier(x1, y1)(x, y)(x2, y2)This command is used to draw quadratic Bézier curves which are commonly used for creating curved lines and shapes. It creates a smooth curve that is defined by three points:(x1, y1)→ the current position(x, y)→ the control point(x2, y2)→ the ending position
In the previously mentioned commands, an object refers to a graphical element that is typically created using various graphics primitives within the picture environment. These graphics primitives include commands such as \line, \circle, \oval, \vector, and others. These commands allow you to draw lines, shapes, circles, vectors, and other graphical elements that can be combined to create complex figures and diagrams.
Here are some commonly used commands within the picture environment:
The \line command
The \line command allows you to draw a straight line of a specified length in the direction determined by the (x, y) arguments.
\line(x, y){length}
The (x, y) arguments represent the direction or slope of the line to be drawn. Here's how they work:
-
If
(x, y)is set to (1, 0), it means the line will be drawn horizontally from left to right. Thexcomponent determines the amount of horizontal displacement, while theycomponent remains zero, indicating no vertical displacement. -
If
(x, y)is set to (0, 1), it means the line will be drawn vertically from top to bottom. Theycomponent determines the amount of vertical displacement, while thexcomponent remains zero, indicating no horizontal displacement. -
If
(x, y)is set to (1, 1), it means the line will be drawn diagonally upwards and to the right. Both thexandycomponents contribute to the slope of the line, with a ratio of 1:1. -
Similarly, you can adjust the values of
(x, y)to create lines with different slopes. For example, (2, 1) will create a steeper diagonal line, while (1, 2) will create a gentler diagonal line.
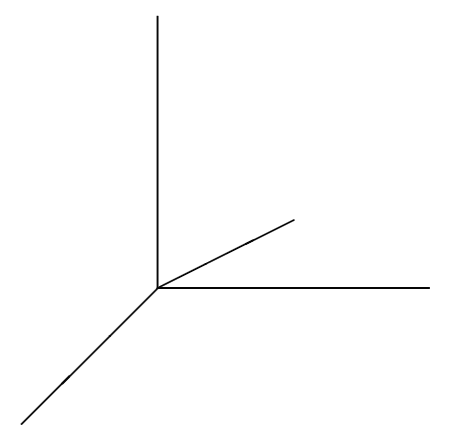
Here's an example that demonstrates the usage of the \line command:
\documentclass{article}
\setlength{\unitlength}{1cm}

\begin{document}
    \begin{picture}(6, 4)
        \put(1, 1){\line(1, 0){2}} % Horizontal line
        \put(1, 1){\line(0, 1){2}} % Vertical line
        \put(1, 1){\line(2, 1){1}} % Diagonal line
        \put(1, 1){\line(-1, -1){1}} % Diagonal line
    \end{picture}
\end{document}
This example generates the following output:
The \circle command
The \circle command is used to draw circles or circular shapes with the specified radius within the picture environment. Here's the syntax of the \circle command:
\circle{radius}
The circle is centered at the current position.
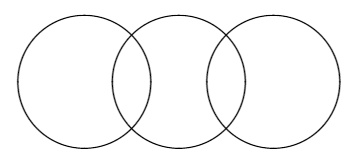
Here's an example that demonstrates the usage of the \circle command:
\documentclass{article}
\setlength{\unitlength}{1cm}

\begin{document}
\begin{picture}(4,4)
    \put(0, 2){\circle{3}}
    \put(1, 2){\circle{3}}
    \put(2, 2){\circle{3}}
\end{picture}
\end{document}
This example generates the following output:
The \oval command
The \oval command is used to draw an oval or an ellipse shape within the picture environment. The syntax of the \oval command is as follows:
\oval(width, height)
width→ This parameter specifies the width of the oval.height→ This parameter specifies the height of the oval.
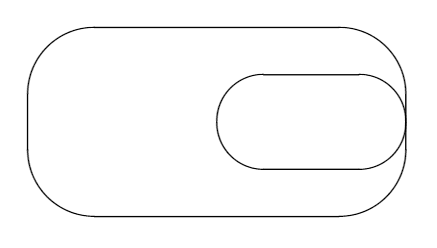
Here's an example that demonstrates the usage of the \oval command:
\documentclass{article}
\setlength{\unitlength}{1cm}

\begin{document}

\begin{picture}(6, 4)
    \put(1, 1){\oval(4, 2)} % Draw an oval with width 4 and height 2
    \put(2, 1){\oval(2, 1)} % Draw an oval with width 2 and height 1
\end{picture}

\end{document}
This example generates the following output:
The \vector command
The \vector command is used to draw a vector or an arrow. It allows you to create arrows of different lengths and directions within the picture environment. The syntax of the \vector command is as follows:
\vector(x, y){length}
(x, y)→ These parameters specify the direction of the vector by specifying the horizontal and vertical components. For example, (1,0) represents a vector pointing horizontally to the right, and (0,1) represents a vector pointing vertically upwards.length→ This parameter specifies the length of the vector.
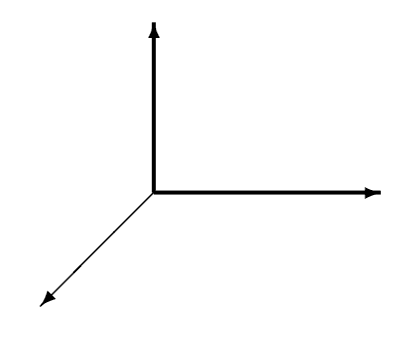
Here's an example that demonstrates the usage of the \vector command:
\documentclass{article}
\setlength{\unitlength}{1cm}

\begin{document}

\begin{picture}(8, 4)
    \linethickness{1pt} % Set the thickness of the lines
    \put(1, 2){\vector(1, 0){2}} % Draw a vector pointing to the right
    \put(1, 2){\vector(0, 1){1.5}} % Draw a vector pointing upwards
    \put(1, 2){\vector(-1, -1){1}} % Draw a diagonal vector
\end{picture}

\end{document}
This example generates the following output: